- using a heating film placed inside the down jackets;
- by measuring the losses through the down jackets when they are worn by a person.
 Figure 1: View of the support and the heating films


Figure 3: View of down jackets positioned on the table during an indoor test (K-Way on the right )
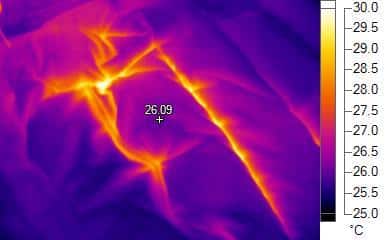
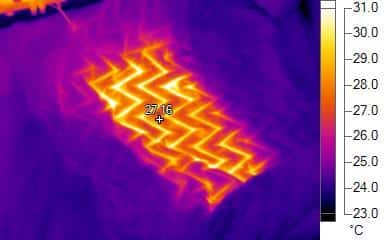 Figure 4: Thermal images of the outside of the down jackets during tests with a heating film (inside); K-Way on the right
Figure 4 presents the thermal images of the outer surface of the two puffer jackets. These are images in false colors which allow you to visualize the distribution of the losses: the rather blue or black areas are the areas where the losses are the least significant. The clear areas (yellow or white) are those where the losses are the most important.
We notice that the seams appear lighter, a sign that the losses in these areas are greater.
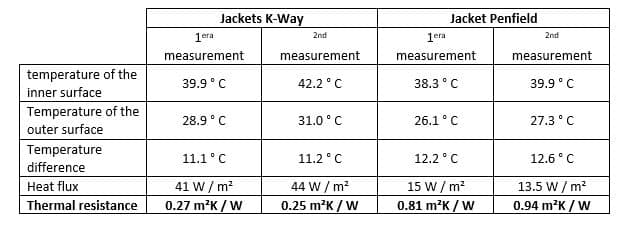
Two tests were carried out. The measured values of temperature and flow are presented in table 1. From these measurements, one can calculate the thermal resistance of the down jacket: it is the value of the difference of temperature inside-outside divided by the flow which crosses clothing. The indoor air temperature was 21 ° C and the relative humidity 50%.
Note that the K-Way down jacket has a thermal resistance about 3 times lower than the other down jacket. This means that for the same temperature difference, it lets around 3 times more heat through.
Table 1: Results of the indoor measurements
 2 °) Tests on people (outdoors):
In this second case the down jackets were worn by two people. Two measurements were made. Between these two measurements, the two people exchanged the down jackets. The sensors were positioned in the same place as for the other tests. The two people put on and closed their down jackets inside, then went out. The measurements were made a few minutes after their release. The only difference from the first type of test is that it is the people who heat the inside of the down jacket. The outside air temperature was 13.5 ° C and the relative humidity 68%.
In Figure 5, we see the two people during the second measurement. Figure 6 shows the corresponding thermal images (back and front). Table 2 shows the measurement results.
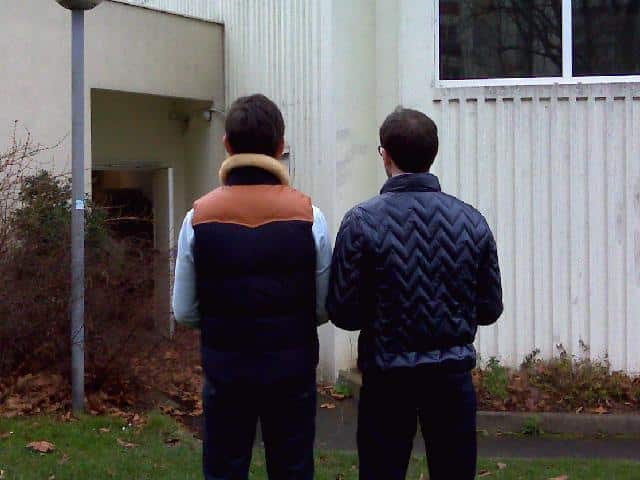
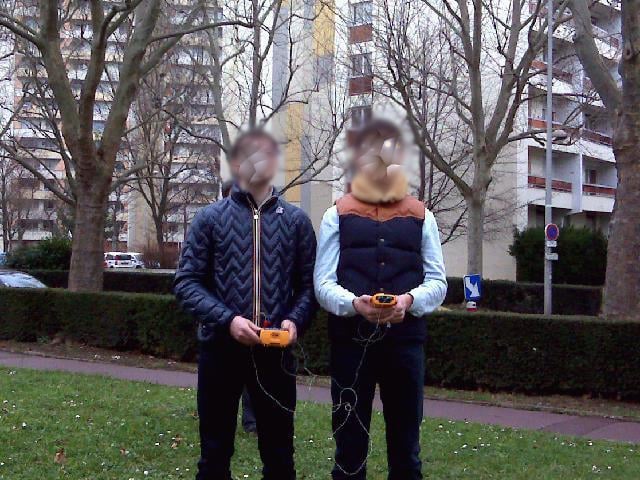
Figure 5: Photographs taken outdoor
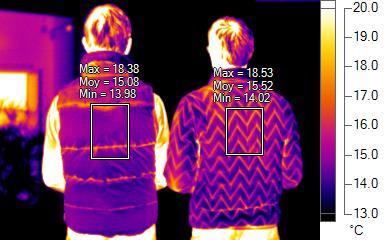
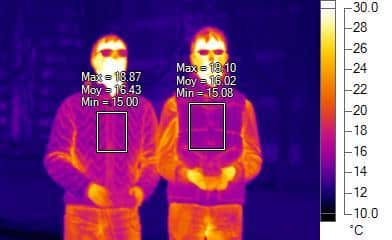
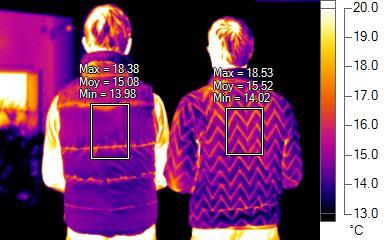
Figure 6: Thermal Images taken outside (back and front)
Table 2: Outdoor Measurement results There are higher thermal resistance values than the first method, probably due to poorer contact between the back and the flowmeter attached to the jacket, therefore an additional layer of insulating air. However, this phenomenon is observed for the two down jackets. The thermal resistance of the K-Way model is approximately 3 times lower than that of the other model, which confirms the previous results.
