Importance and limitation of spectral measurements
Importance and limitation of spectral measurements for emissivity measurement
Authors:
Jean-Pierre MONCHAU, THEMACS Ingénierie, 2bis rue Alfred Nobel, 77420 Champs sur Marne,monchau@themacs.fr
Laurent IBOS, Université Paris-Est, CERTES/OSU Efluve, 61 avenue du Général De Gaulle, 94010 Créteil Cedex, ibos@u-pec.fr
Mario MARCHETTI, CEREMA, Laboratoire Régional de Nancy,71, rue de la Grande Haie – 54510 Tomblaine,Mario. Marchetti@cerema.fr
Jean DUMOULIN, IFSTTAR, Dépt. CoSys, Route de Bouaye, 44344 Bouguenais Cedex, jean.dumoulin@ifsttar.fr
Vincent FEUILLET, Université Paris-Est, CERTES/OSU Efluve, 61 avenue du Général De Gaulle, 94010 Créteil Cedex, vincent.feuillet@u-pec.fr
Emissivity
Emissivity is a thermophysical property of materials important for quantifying heat exchange by radiation. It is also essential for measuring the surface temperature from a luminance measurement such as for example by infrared thermography.
The latter technique is becoming more widespread with the democratization of thermal cameras with micro-bolometer arrays. Emissivity measurement at room temperature is generally done by the indirect method using Kirchhoff’s law relating emissivity to reflectance for an opaque material. Several commercial devices exist, however, these devices have measurement biases. To correct these defects, it is necessary to know the spectral behavior of the material.
The measurement of the spectral reflection factor with a Fourier transform infrared spectrometer (FTIR) equipped with an integrating sphere makes it possible to obtain this information. The spectral limitation of integrating spheres (generally 1-20 µm), however, prevents the need for an emissometer covering a wider spectral range.
CERTES has developed a measurement protocol combining the two techniques (broadband and spectral) to obtain an unbiased emissivity value, corrected for variations in the temperature of the source. This method has been successfully tested for different materials, in particular ceramics such as alumina (Al2O3) exhibiting strong variations in reflectance in the band from 1 to 20 µm. These results are presented in this article.
Definition of emissivity
Max Planck theoretically determined the spectral emittance of an ideal body called a black body using quantum theory (Figure 1). Real surfaces radiate similarly but emittance is weighted by a dimensionless coefficient called emissivity.
his coefficient depends on the material, its temperature, the wavelength and the incidence (here the angle of emission). Thermal engineers prefer to use an integrated coefficient over the whole spectrum and for all the incidences called total hemispherical emissivity in order to be able, for example, to quantify the quantity of heat lost by radiation by a surface.
The difficulty is therefore to determine this coefficient without neglecting wavelengths or incidences.
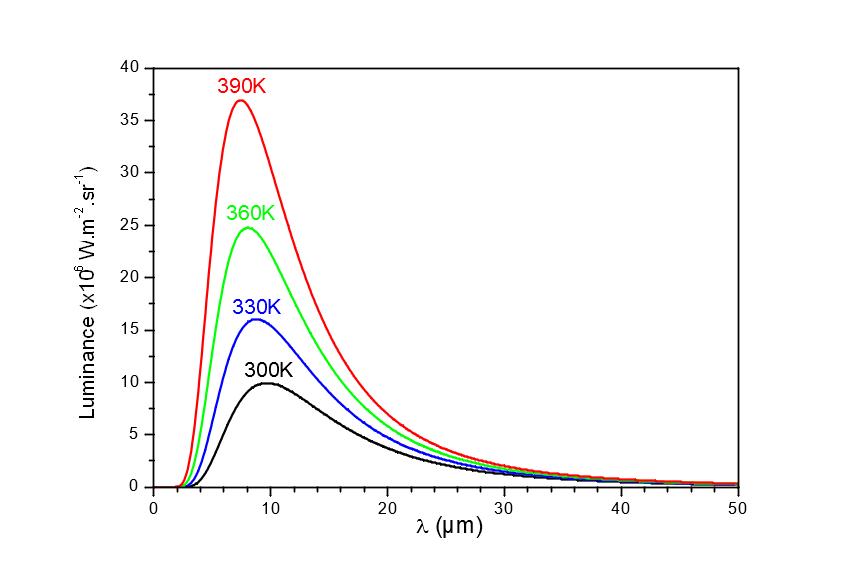
Figure 1
Luminance of a black body L(λ) for different temperaturesT
To measure the emissivity there are many approaches that we can classify in two categories: the direct methods measure the energetic radiation of the studied surface and the indirect methods deduce emissivity from other optical properties of the surface.
Among the direct methods, one can quote the calorimetric method which consists in measuring the electric power to be supplied to a sample (placed in a cryostat under vacuum) to maintain its surface temperature equal to the temperature at which one wishes to know the emissivity. The National Metrology and Testing Laboratory (LNE) has a measuring bench of this type [3].
Another method, called radiometric, consists in measuring the thermal radiation coming from the surface of the material. This measurement can be done as a function of the angle to obtain the directional emissivity and as a function of the wavelength (with an FTIR spectrometer for example) to obtain the directional spectral emissivity. The CEMHTI device (Extreme Conditions and High Temperature Materials and Irradiation) allows this type of measurement at very high temperature [4].
For the measurement of emissivity at ambient temperature, the level of the flux is too low to be measured with good precision: this is the privileged domain of indirect methods. These use Kirchhoff’s law relating the emissivity ε to the reflectance ρ and to the transmittance τ for a wavelength λ given:

the emissivity being equal to the absorptivity. For an opaque material, the emissivity is therefore equal to:

To obtain the total emissivity we must therefore add the spectral reflection factor (first time I see this word) weighted by the spectral energy distribution of the black body at the temperature at which one wishes to know the emissivity:
The other solution is to measure the global reflection factor by illuminating the surface with a light source having this energy distribution.
Several commercial devices measuring emissivity use this method. Their main quality is to measure the reflectance in a spectral band ranging from 1 to 50 µm which represents 95% of the energy radiated by a black body at ambient temperature (around 300K). However, they integrate the reflection factor for a spectral distribution different from the ambient temperature.
In fact, they use black or gray bodies as infrared sources at a temperature above ambient temperature. These sources have spectral distributions different from that of a black body at 300 K. This difference in spectral distribution leads to emissivity measurement errors for non-gray bodies of up to 5%. This defect is nothing new.
Indeed the standard ASTM E408-71 (Standard Test Method for Total Normal Emittance of Surface Using Inspection-Meter Techniques) states it. We can also refer to [5] where this type of error is briefly mentioned.
The emissometers developed at CERTES [1,2] use infrared sources modulated in temperature at temperatures very close to ambient temperature. The problem remains unresolved because modulation significantly affects the spectral distribution of the source (see box 1).
To remove this uncertainty, it is necessary to measure the hemispherical directional spectral reflectance (this is equal to the directional hemispherical reflectance for reciprocity reasons). The only commercial devices allowing this measurement to be made are the integrating spheres. They can be coupled to FTIR spectrometers and allow measurements in the spectral band 1-20 µm.
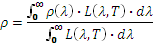
Which today limits the spectral range of trade integratingspheres, the inner lining of these. It must be perfectly diffusing (Lambertian behavior). This is no longer the case for wavelengths greater than 20µm. We must therefore be satisfied with this spectral band which represents only 76% of the energy radiated at 300 K. The device used at CERTES and by THEMACS Engineering is an infrared spectrometer with Fourier transform FRONTIER©of the brand Perkin-Elmer©. The spectrometer is completed by an integrating sphere of the PIKEbrand©.
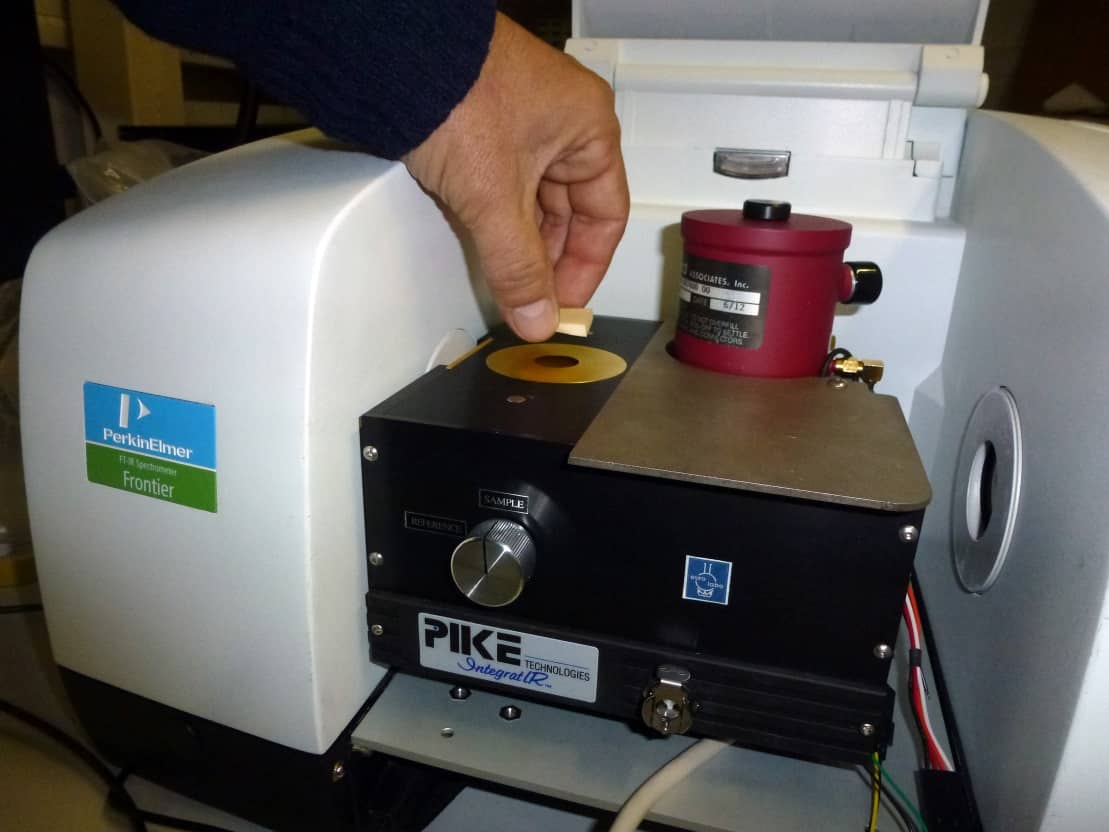
Figure 2
FTIR FRONTIER Perkin-Elmer spectrometer used and detail of the PIKE integrating sphere accessory
Figure 3
Spectral reflection factor as a function of the wavelength of an alumina sample
These experimental devices are visible in figure 2. Despite this limitation, the spectral measurement gives exact information on the variations in emissivity as a function of temperature. By combining the two techniques (spectral measurement and broadband measurement) we can go back to an exact emissivity measurement. We can illustrate this method by studying alumina (Al2O3) :
For example, in the case of alumina, the sample used is in the form of amorphous ceramic. This type of material is a textbook case because its directional spectral emissivity varies greatly around 10 µm (Figure 3), ie around the maximum emission of a body at room temperature.
This is frequently the case for this type of ceramic. Furthermore, bibliographic data cannot be used. Indeed, depending on the allotropic variety, the degree of crystallization, the different heat treatments, etc., the values of the directional spectral emissivity of alumina are very variable [6].
When the temperature of the surface studied varies from room temperature to higher temperatures, the maximum luminance of the Planck function L ( λ, T) shifts by 10 µm to shorter wavelengths.The maximum luminance is reached for a wavelength λmax(in µm) = 3000 /T, with T in K.
For alumina, this has the effect of increasing stress on a much more emissive spectral region. The emissivity therefore increases with temperature. We can calculate the emissivity by taking into account only the spectral band from 1 to 20 µm. These data are presented in Table 1. This calculation neglects an important part of the useful spectrum. The calculated emissivity value is therefore incorrect.
However, given the monotonicity of the Planck function for wavelengths greater than 20 µm for this temperature, the variations in emissivity as a function of temperature therefore only depend on the spectral band from 1 to 20 µm. In the absence of knowing the value of the emissivity, we can therefore deduce the coefficient of variation of the emissivity according to the temperature fairly precisely. If we are able by another means to measure the emissivity for a temperature higher than the ambient temperature, we can therefore deduce the emissivity at all temperatures around 300 K.
This can be seen on the graphs of figure 4. From the spectral measurements (top graph of figure 4) we can obtain the variations in emissivity as a function of temperature (bottom graph of figure 4, blue line). The EM2 emissometer of CERTES [2] (figure 5) makes it possible to obtain an unbiased value of the emissivity but only at 360K. From these two pieces of information, we go back to the unbiased emissivity as a function of the temperature (bottom graph of figure 4, red line).
Table 1

Emissivity calculated from spectral data between 1 and 20 µm at different temperatures
Figure 4
Spectric reflectance of alumina, top; calculation of emissivity from spectral measurements and a broadband emissometer (EM2 [2]), below.
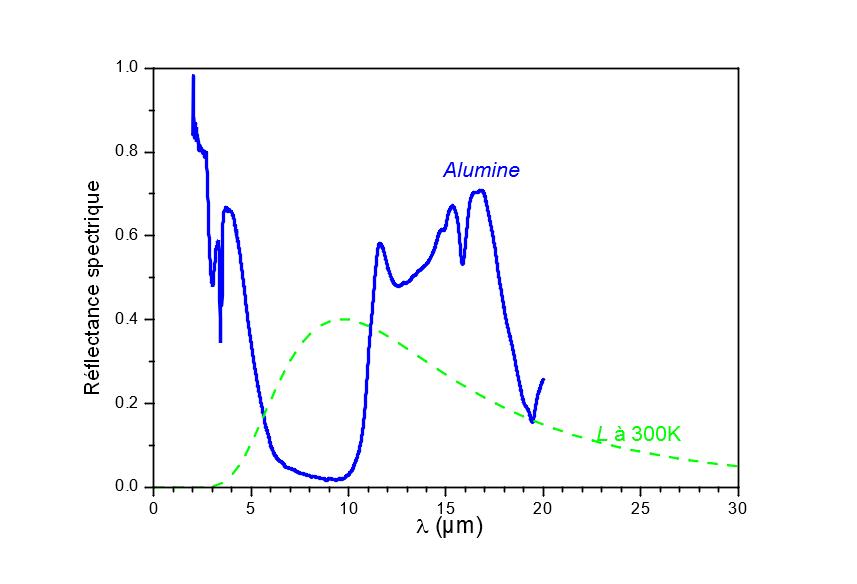
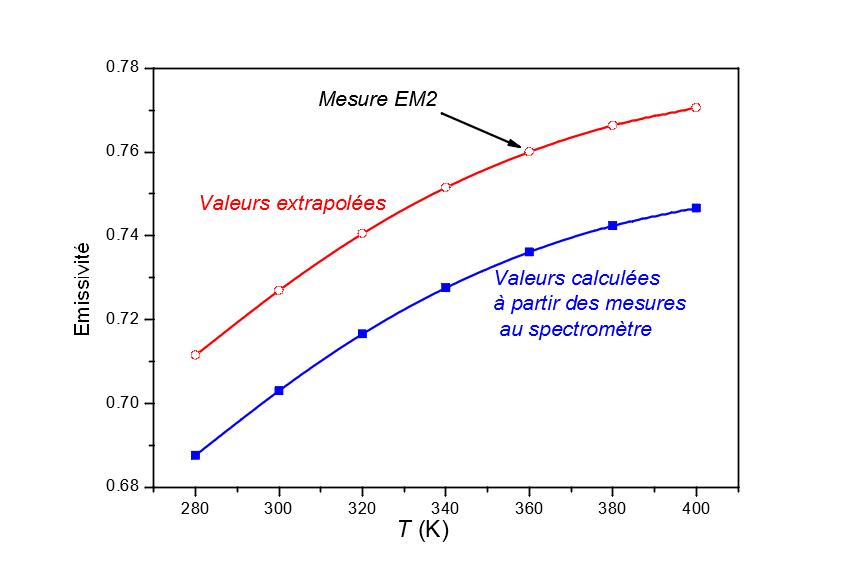
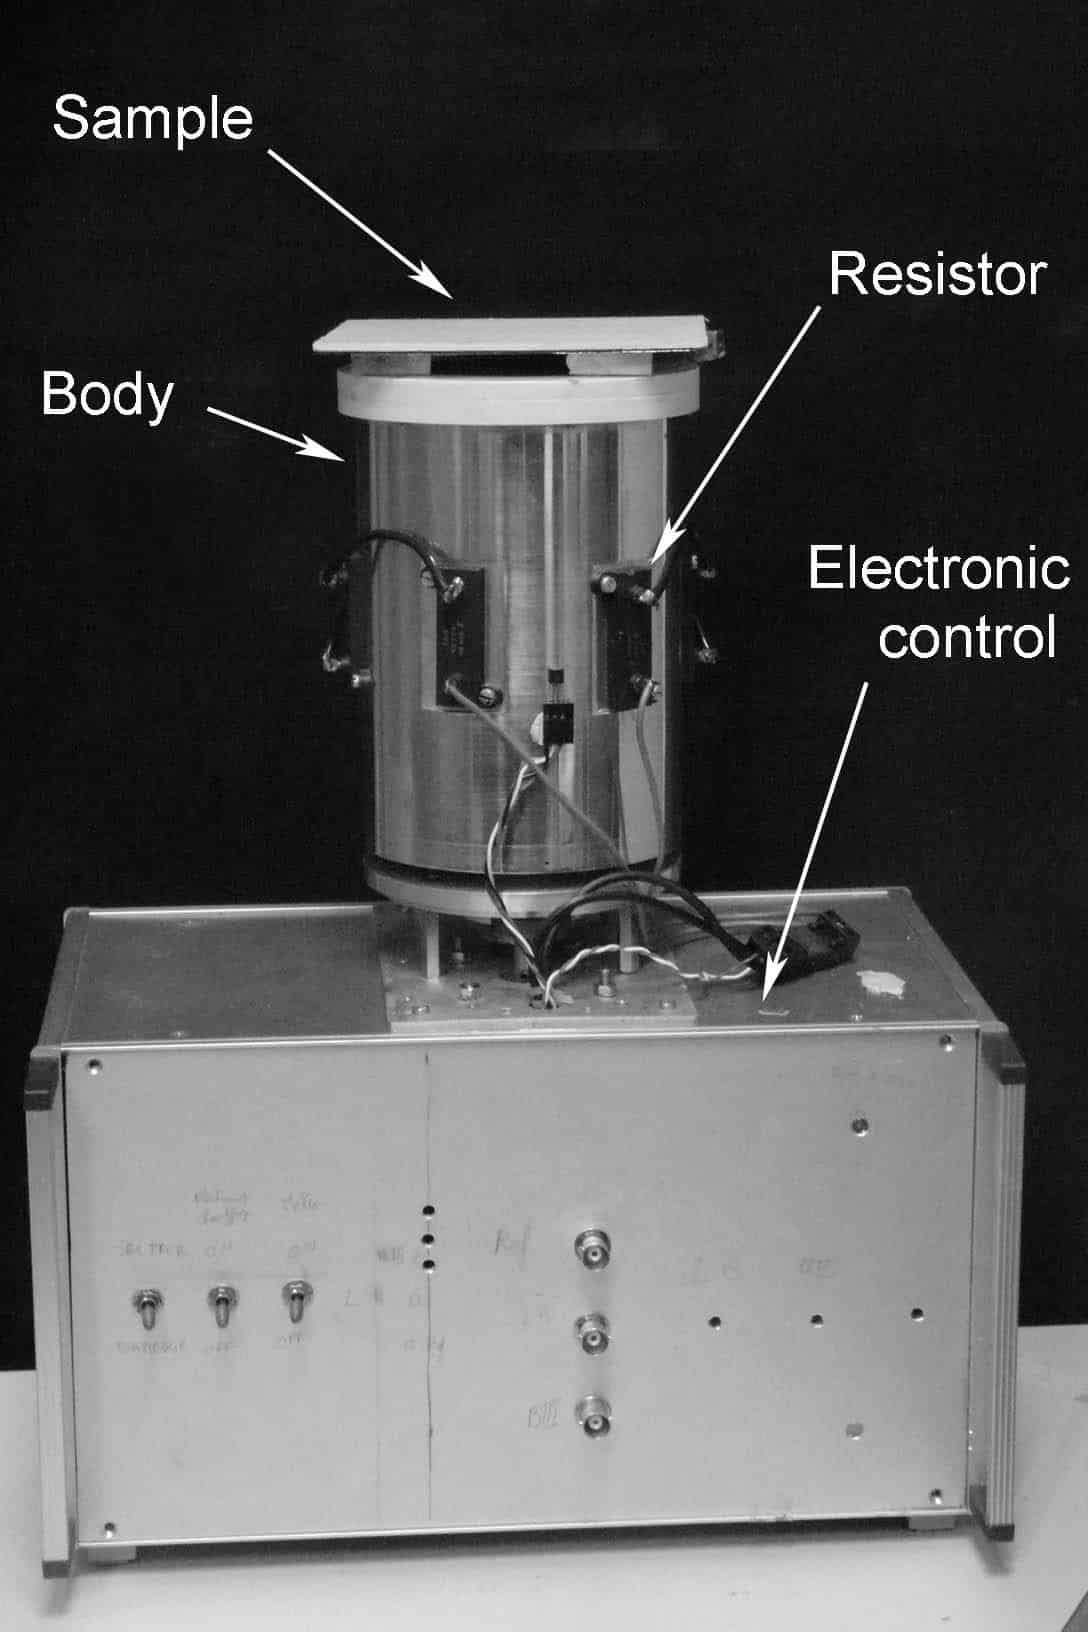
Figure 5
EM2 emissometer, developed at CERTES Breveté in 2012 (FR 2987121)
Conclusion
The measurement of the spectral properties of surfaces in the infrared domain is essential to know the radiative behavior of these surfaces. The only measurement of the emissivity with a commercial apparatus does not make it possible to reach an exact value of the emissivity. Most of these commercial devices were designed for production control, not for obtaining a directional emissivity value.
The combination of the two measurement methods and a good knowledge of the characteristics of the devices used make it possible to obtain measurements free from systematic errors.
The numbering does not correspond to the order of appearance in the document
- L. Ibos, M. Marchetti, A. Boudenne, S. Datcu, J.Livet, Y. Candau, Infraredemissivitymeasurementdevice:
Principle and applications, Meas. Sci. Technology.17, 2950 (2006) - J-P. Monchau, M. Marchetti, L. Ibos, J. Dumoulin, V. Feuillet, Y. Candau, Infrared Emissivity Measurements of Building and Civil Engineering Materials: A New Device for Measuring Emissivity,Int. J. Thermophys., in press
- J. Hameury, B. Hay, J. R. Filtz, Measurement of Total Hemispherical Emissivity Using a Calorimetric
Technique, Int. J. Thermophys, 28, 1607 (2007) - O. Rozenbaum, D. De Sousa Meneses, Y. Auger, S. Chermanne and P. Echegut, A spectroscopic method to
measure the spectral emissivity of semi-transparent materials up to high temperature, Rev. Sci. Instrum. 70, 4020 (1999) - K.E. Nelson, E.E.Leudke, J.T.Bevans, A device for rapid measurement of total emittance, Journal of
Spacecraft and Rockets, 3, 758 (1966) - Thermophysical Properties of High Temperature Solid Materials, Vol. 4, Y. S. Touloukian Editor
BOX
Errors due to the temperature modulation of the source
This case concerns the methods using a reflectometric method involving a modulated source. It is assumed that the spectral distribution of the source does not vary significantly when the temperature variations are small. This assumption is exact, however with these methods, one does not measure the flux reflected by the sample but only the variations of reflected flux.
This also applies for sources chopped by a mobile screen (chopper). In fact, in this case, the alternation between the temperature of the source and that of the screen is measured. If the temperature T is a periodic function of time, we must consider its expression as a function of time T(t) where t is time. The signal measured by the detector is equal to:
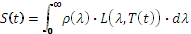
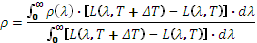
where L(λ,T)is the luminance of the black body for λ wavelength Ttemperature.This difference is illustrated in Figure 6.
Since in this case we are only interested in periodic variations of this luminance, the measurement is therefore proportional to the peak-to-peak amplitude denoted A measured by the detector for temperature variations ΔT above the minimum temperature (for reasons of writing simplicity, it is assumed that the temperature varies between T and T+ΔT):
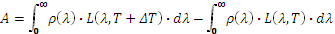
If we measure the signal corresponding to the incident flux, we can obtain the total reflection coefficient in the band spectral coverage by the detector:
It can therefore be seen that in reality, the reflectance is measured with a source having a spectral distribution equal to the difference in luminance of two sources of different temperatures. This spectral distribution differs significantly from the spectral distribution of a black body at average temperature.
Figure 7 shows the luminance of a black body at 300 K and 360 K as well as the difference in luminance between two black bodies at 300 K and 305 K. The curves have been normalized for ease of reading. Note that the spectral distribution of the modulated source no longer follows Planck’s law, but approaches the spectral distribution of a black body at 360 K. For this error to have only a negligible influence, the sample must be able to be assimilated to a gray body around 10 µm or know the spectral properties of the studied surface.
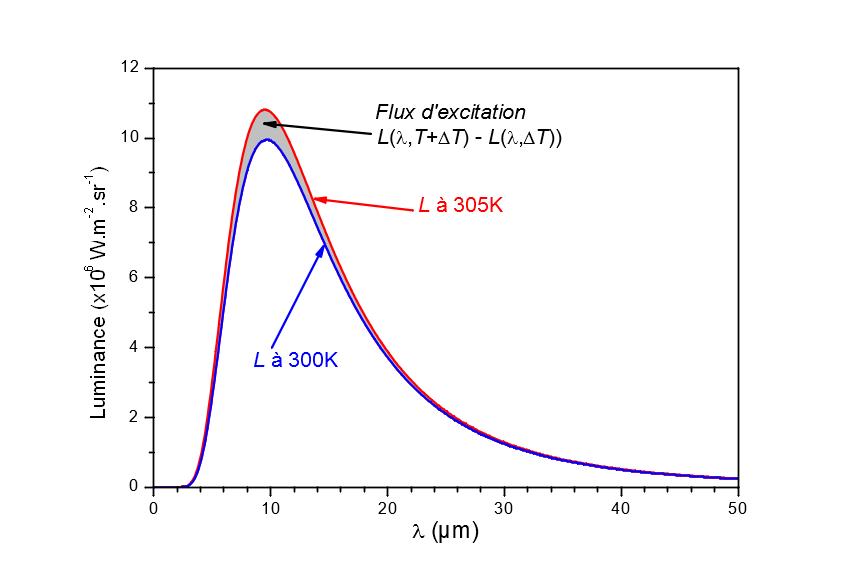
Figure 6
Determination of the spectral distribution of the excitation flux of a modulated source
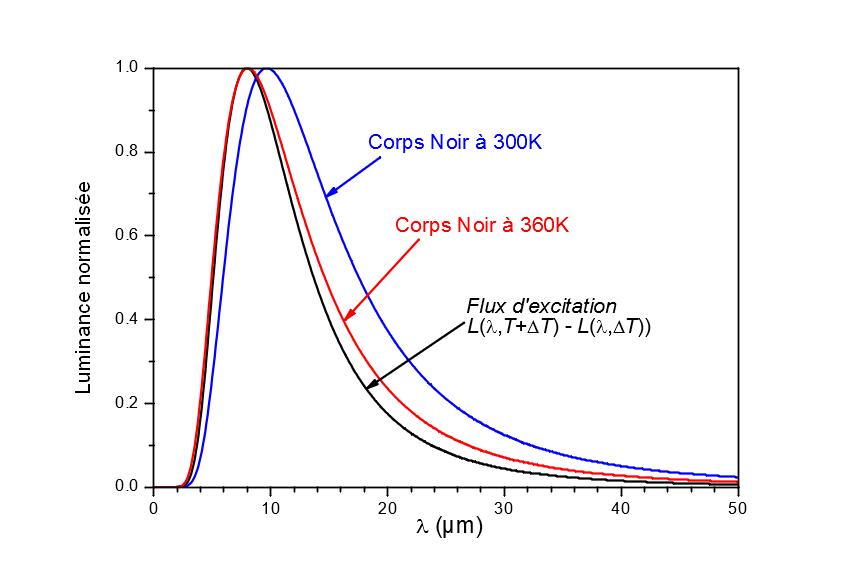
Figure 7
Comparison of the spectral distribution of the excitation flux of a source modulated around 300 K to that of a black body at 360 K
Our team advises you to best meet your expectations